While knowing your personality type can influence your trading style, understanding your trading strategy is crucial before you start trading.
We all know that the key to making money on the stock market is to BUY LOW and SELL HIGH.
But knowing when to buy and sell will always be the only challenge in making money on the stock market.
A stock usually changes whenever a company makes an announcement or whenever there is relevant news in that specific industry.
This is just one of various strategies for making money on the stock market.
However, there are other ways to choose a stock, enter it, and exit it.
So, how to create a trading strategy?
Below is the list of basic trading strategies which includes time frames, stock selection methods and Entry & Exits.
TIME FRAMES
Time frame is the period of time in which you view the movement of the price.
For example, 1 day time frame shows you how price moves everyday for a given time range (eg.1 year). Each bar on the chart will represent 1 day.
First choose your time frame according to your trading style.
If you are a scalper, you can choose 15 mins time frame to determine the trend and for stock selection. And use 3 mins time frame for entry and exits.
If you are a day trader, you can choose 1 hour time frame to determine the trend and for stock selection. And use 15 mins time frame for entry and exits.
If you are a swing trader, you can choose 1 day time frame to determine the trend and for stock selection. And use 1 hour or 4 hours time frame for entry and exits.
STOCK SELECTION METHODS
As we have already seen, the selection of stocks is the most important phase in developing a strategy. Few of the basics are listed below.
Trend
You can choose the stocks when it has just started to trend and is bit far away from your target.
You can find these trending stocks in
- News,
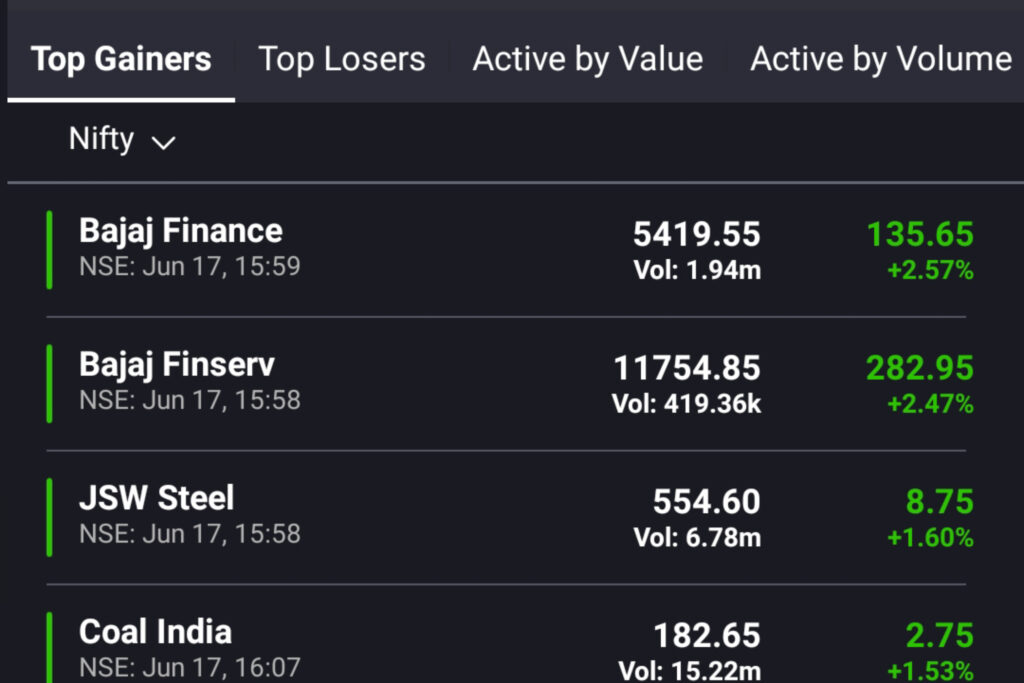
- Top gainers and losers,
- Watchlist sorted out by change %,
- Google Trends
- Company announcements etc.
- Manual Price Action
Selecting these stocks might give you a higher chance of success as it is currently favoured by market participants. You can check all of these on a free site like Moneycontrol …
Range
You can also use stocks in a range or consolidation for a longer periods of time, where the price fluctuates between a certain range and doesn’t go above or below that range.
This type of opportunity is used by range traders where they buy when the stock price is at the low of it’s range and sell it before the high of it’s range or vice versa.
You can also use this to wait for potential breakouts. When there is a tight consolidation or range for a long period of time, there is a possibility of a strong breakout in either direction. When it does, it gives huge returns!
You can find these stocks by using screeners which can scan for stocks in consolidation, bollinger squeeze breakouts etc.
Counter trend
You can use this type to trade on stocks that are about to make a pullback or reversal.
This is against the trend, hence the name counter- trend.
You can find stocks which are trending and wait for it to reverse.
You can scan using indicators like RSI to find the reversal stocks quickly.
Volume
Stock selection based on volume is the most popular method as huge volume indicates that more market participants are interested in that stock at that particular time.
You can select these high volume stocks by scaning for Volume Shockers in financial websites or just by using a custom scanner.
Price action or Indicators
You can also select stocks based on price action breakouts, indicator signals etc. on a higher time frame.
You can do so by using a scanner or by tracking the stocks manually.
Other market data
You can also select stocks based on open interest, delivery quantity etc. All of these indicates how interested the market participants are at that particular period of time.
ENTRY & EXITS
Now you know how to select stocks based on your preferences, it is time to move on to the main problematic area, which most people struggle, is determining your entry and exits.
BASED ON TOOLS
You can enter and exit based on the tools used to indicate signals. This is based on price action or indicators.
Price action
Price action is just the method of prediction based on the movement of price. It involves understanding the basic psychology of market participants.
Following are the basic types of price action considered for entry and exits..
Candlesticks
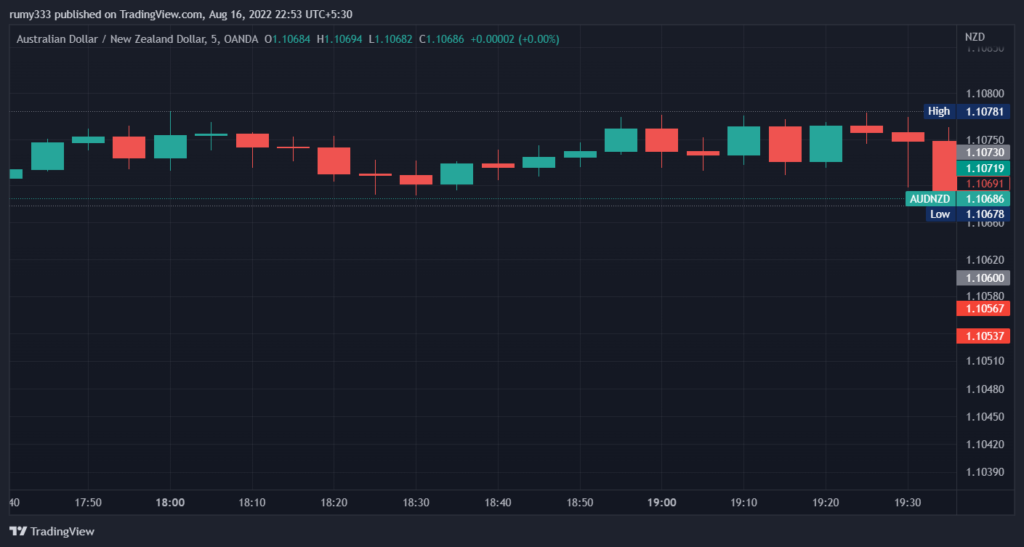
Candlestick is the type of chart view instead of seeing just the line chart.
Here, every time period (eg. 5 mins) has 1 candle depending on the open and close of the price.
If the close is greater than the open, the bar will be green in color. This is called a bullish candle. This means more people are interested in buying the stock.
If the price closes is below the open price, the bar turns into red color. This is called bearish candle. This means more people are interested in selling the stock.
You can also change the color of the bars according to your preferences.
There are also many candlestick patterns, which when formed is a confirmation to enter the trade.
Example
– When the 1 hour candle opens above the previous green candle.
– When there is a candlestick patterns like bullish engulfing pattern.
– When there is a big candle with huge volume.
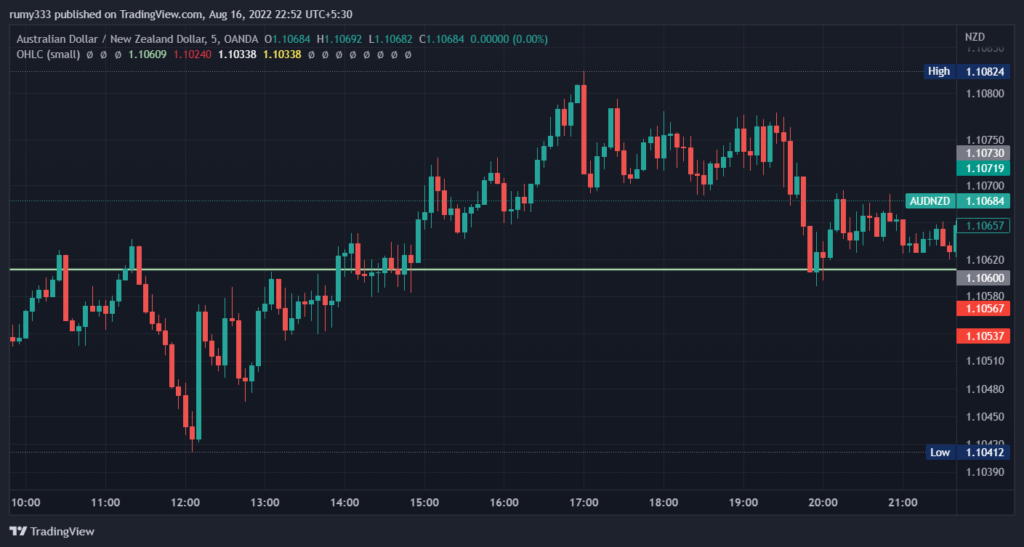
Support and Resistance
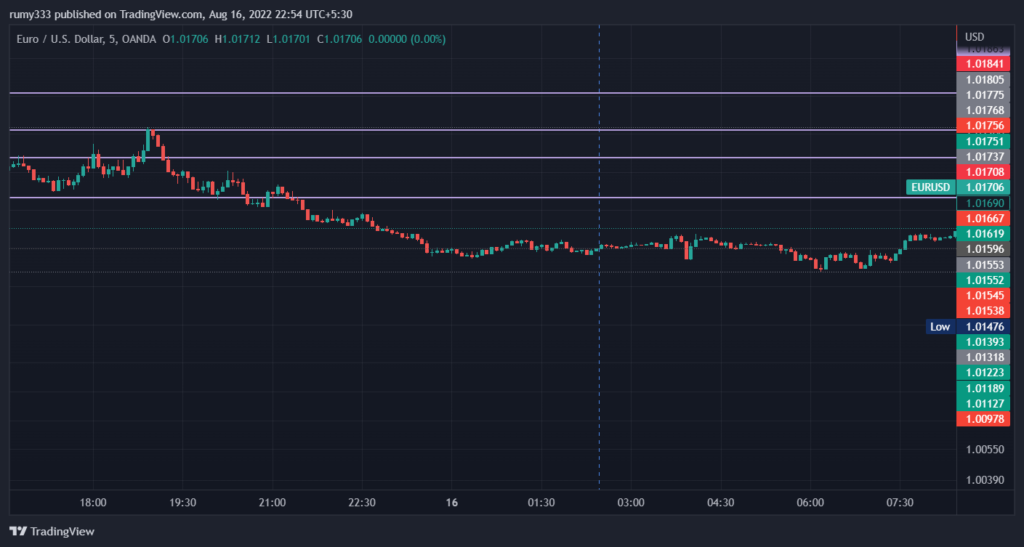
Support and resistance is the area where the price struggles to move past it.
When the price struggles to move above a certain price range, that line or area is called Resistance level.
When the price struggles to move below a certain price range, that line is called support level.
Support and resistance can be used to trade breakouts and reversals. This means that support or resistance is a strong price level determined by market participants to be the best price. When it crosses that line, the trend is usually stronger.
Example
Bullish :
Entry – Buy when the price breaks above strong resistance level.
Exit – Sell when the price reverses below next strong resistance level.
Chart patterns

Chart patterns are patterns or just shapes formed which gives us a signal to enter and exit.
Chart pattern includes Triangle, rectangle, double bottom (W), double top (M) etc.
My most favourite is rectangle or tight consolidation breakout strategy, which is my go-to strategy for quick bucks.
Example
Entry
– Triangle/ Rectangle breakouts.
– Head and shoulders entry etc.
Exit – Pattern exit
OHLC
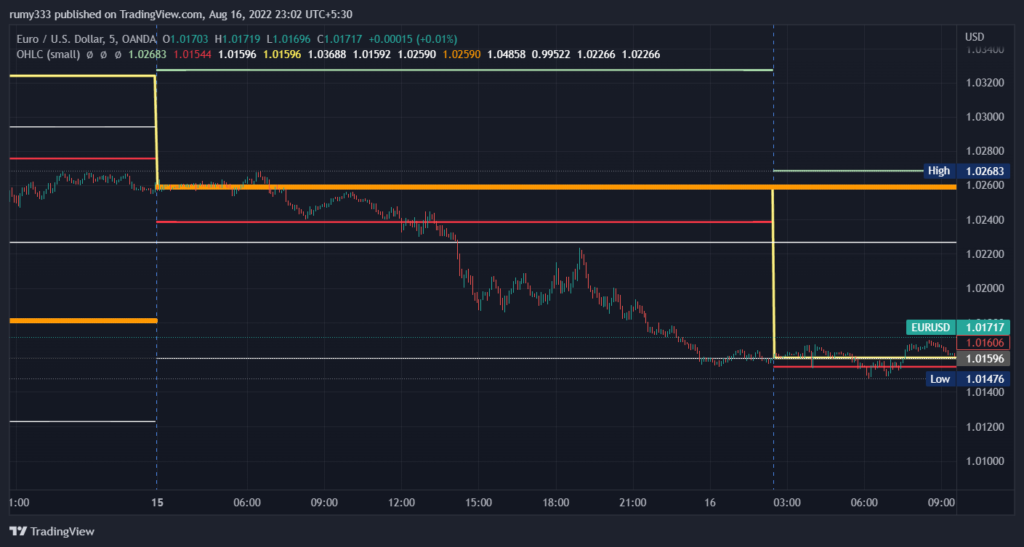
OHLC stands for OPEN HIGH LOW CLOSE.
The previous or current day’s open/high/low/close is a crucial level of support or resistance.
Only after breaking this area of value, the price will consider other levels of support and resistance.
The same holds true for weekly or monthly OHLCs.
Example
Bullish stock :
Entry – When stock closes above today’s open.
Exit – When stock reaches previous day OHLC or current day’s High.
Indicators
Indicators are just mathemetical formulas presented to us in a simple visual manner.
There are 4 types of indicators depending on what they indicate – volume, volatality, momentum and trend.
Trend
You might have seen many traders saying this line repeatedly ” Trend is your friend “. That is 100% true. You can make loads of cash when the stock is trending. As that’s where most of the market participants will be at the current moment.

You can use price action to determine the trend or use trend indicators like moving averages.
Example
Entry : Buy when 50 EMA crosses above 200 EMA.
Exit : Sell when 50 EMA crosses below 200 EMA.
Volume
Higher the volume, more the market participants involved. There are many volume indicators like OBV, MFI etc, but the most commonly used and the easiest to understand is the volume bar indicator.
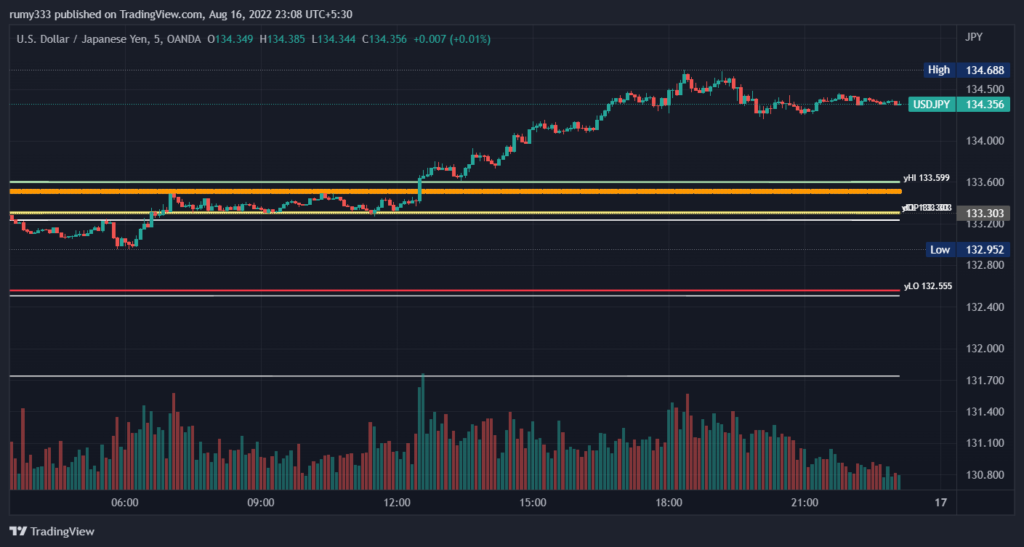
Example
Bullish :
Entry – Buy when there is a huge volume spike with bullish candle.
Exit – Sell when there is a huge bearish volume.
Momentum
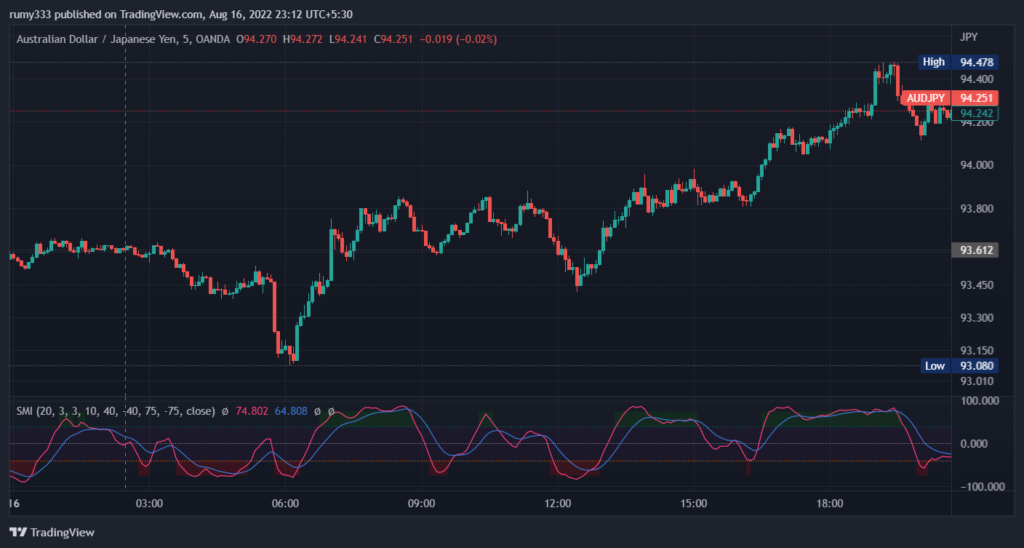
Momentum is the rate of change or simply the speed at which the stock price moves. It usually means there are more market participants involved, who are showing a knee-jerk reaction to any market information. The indicators used are ROC, RSI, MACD, stochastics etc.
Example
Bullish :
Entry – Buy when stochastic momentum index %k crosses above %d.
Exit – Sell when stochastic momentum index %k crosses below %d.
Volatility
Volatality is how much the stock has moved from the usual average price. The indicators used are ATR, bollinger bands, Keltner channel, Donchian channel etc. The most commonly used volatality indicator is bollinger bands.
Example
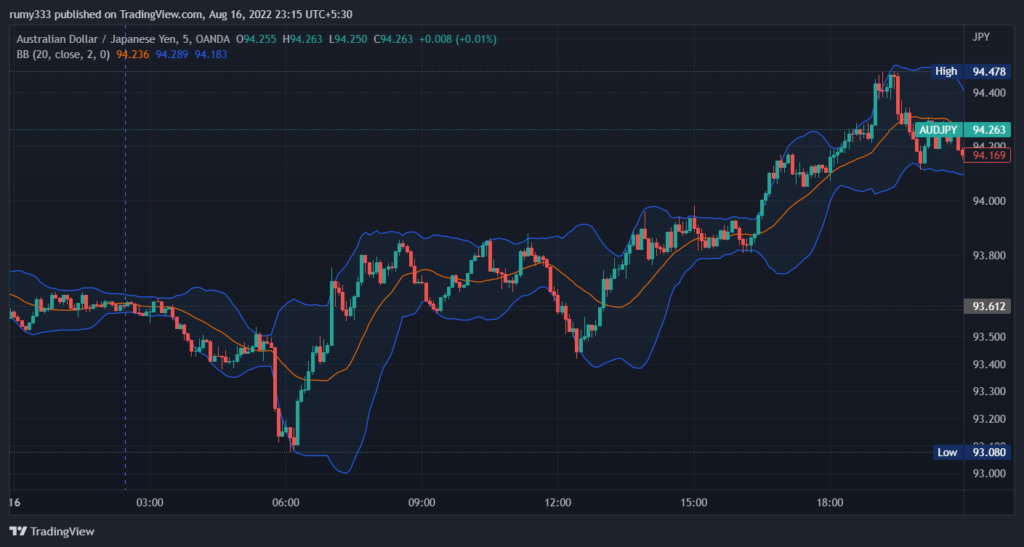
Bullish :
Entry – Buy when price reverses from lower bollinger band.
Exit – Sell when the price touches the middle bollinger line.
Price action and Indicators
You can also use
Price action + 1 Indicator in each type.
Example
Bullish :
Entry – Buy when all of these conditions are met..
The price breaks above major resistance,
Above 200 EMA,
Good volume,
Macd line crosses above 0 &
Bollinger bands widening.

STRATEGIES
Breakout

This type of entry happens when the price crosses a strong area of value, like support and resistance, chart patterns etc.
Reversal
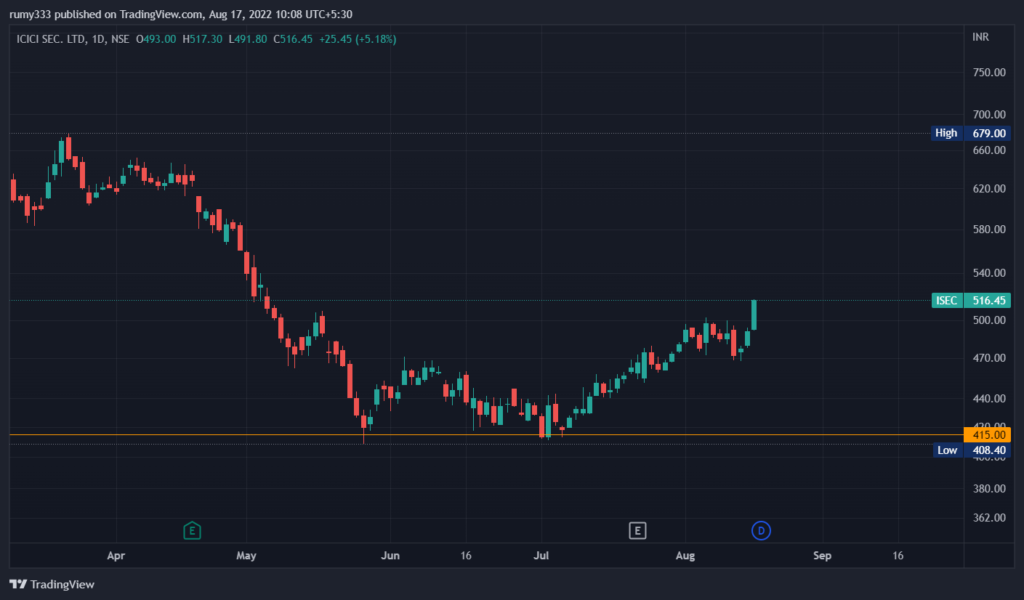
This type of entry happens when the price reverses from a strong area of value, like support and resistance, supply and demand etc.
Pullback
Minor retracements in a trend is called pullbacks. This is my 2nd favourite trading strategy, as it is a high probability setup. This is not my 1st because we never know how many pullbacks will be formed.
You can enter 1 candle above the bullish pullback candle for a bullish trade.

Breakout and retest
Hands down, this is my 1st favourite strategy for any kind of asset or market. It is the highest probability setup I have ever seen.
Just enter when the price gives a pullback after it crosses a strong area of value.
Trading according to the trend and considering other factors like volume, news etc. will give you the edge required to be successful in your trading journey.

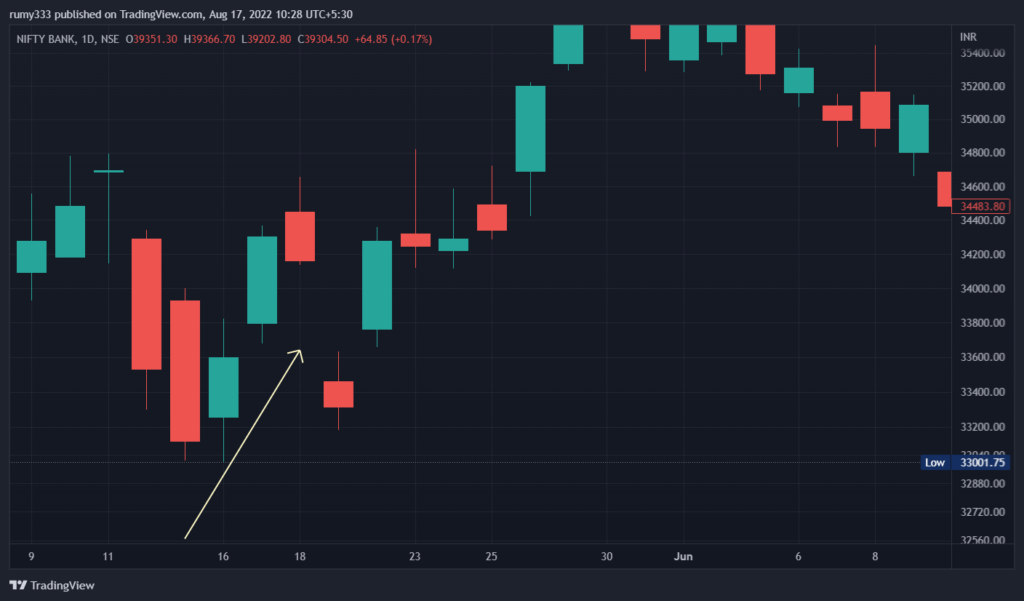
Gap trading
When a gap is formed at the open, the price mostly tends to fill that gap. This is where you enter and make some quick bucks.
Arbitrage
Arbitrage is when you buy a stock in 1 stock exchange and sell in another related stock exchange. Eg. NSE, BSE.
Usually, no indicators are needed as we want to make only small profits from the price difference.

EXIT TYPES
There are usually 3 types of exits.
Signal
Exit according to your price action or indicator signal used for your entry.
Example
Eg. Buy when 10 ema crosses above 20 ema, sell with stop loss or target when 10 ema crosses below 200 ema.
RRR
Exit according to your risk reward ratio.
Example
Eg. Risk : Reward = 1:2
Stop loss = 1% of my capital = 100 pts.
Target = 2% or 200 pts.
TSL
Trailing your stop loss after breakeven.
Example
Eg. Set your trailing stop loss so that when the price moves 10% in your preferred direction, stop loss also moves 10%.
MONEY & EMOTIONAL MANAGEMENT
Timeframes, stock selection, entries and exits determines your trading strategy. Also remember to incorporate money and emotional management rules in your trading strategy.
Money management
Set some basic rules to protect your capital. You can fix your stop loss %, lot size or quantity, target etc. so that you will have some constants to make a profitable trading strategy in our random market.
Example
– Do not risk more than 2% of your trading capital in a trade.
Emotional management
Following the trading strategy is the only thing you will have to do after creating your strategy. But that is not easy. Emotions play a huge role in our trading journey.
So you can set some rules like using a trading journal, practising mindfulness meditation, trading habits etc. and follow it every time.
Example
– Set your stop loss and target, close your system and check only before the close of the market. (Reason – Develop this habit to avoid changing the stop loss or target out of fear or greed.)
These are the basic things you need to know to create your very own trading strategy. Feel free to leave your questions or tips in the comment section below.
About Post Author
Resources & Links
Tradingview – Charting Platform
Zerodha – Trading brokerage platform (India)
Disclaimer
Trading involves substantial risk, and past performance is not indicative of future results. Always conduct your own research and consider seeking professional advice before making any investment decisions. The information provided on this platform about digital entrepreneurship is based on the author’s experiences and industry knowledge. It should not be considered as financial, legal, or business advice. Please consult with experts in these fields before making business decisions. This blog may contain affiliate links, and we may earn a commission if you make a purchase through these links. Your support is appreciated.


