
Nowadays there are so many indicators which indicates price action. Let’s look at some of the popular ones here..
Eg. Volume, chart patterns, candlestick patterns, support and resistance, trendline, higher high lower low, elliot wave, fibonacci etc.
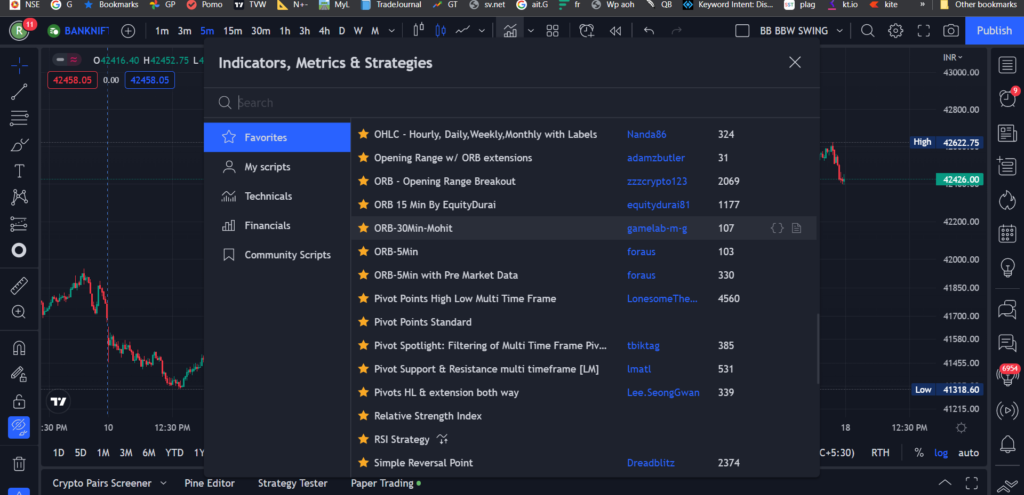
OHLC
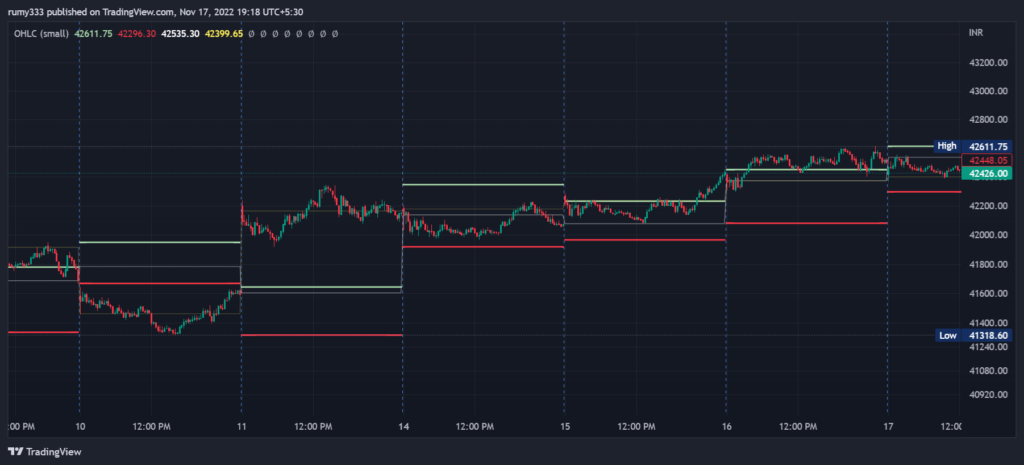
The OHLC indicator is also known as the OPEN HIGH LOW CLOSE indicator. This indicator will show the previous day’s high, low, and close, as well as the current day’s open. You can also modify the settings to suit your needs.

Auto support and resistance
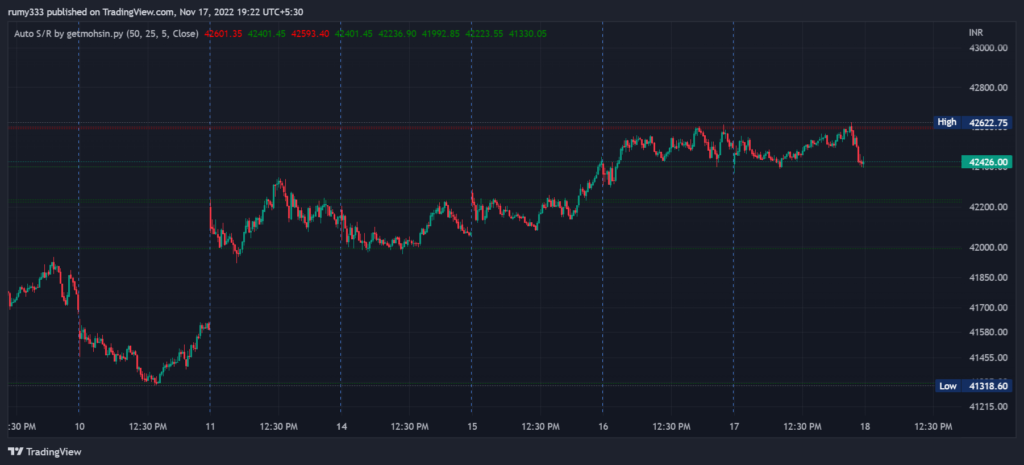
The following option is automatic support and resistance. It draws supported and resistance lines on the given data automatically. We can also change the settings and specify how many previous candles we want to see.
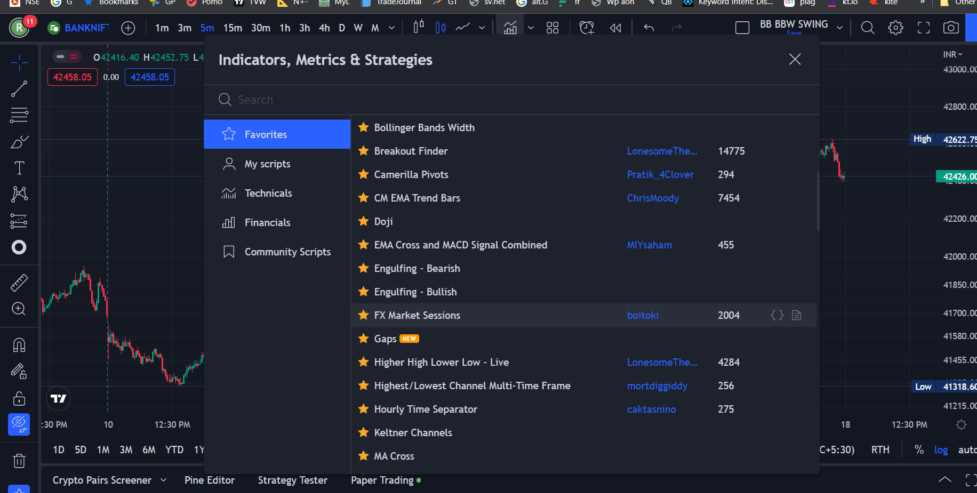
Breakout finder

This breakout finder.indicator alerts you whenever a breakout occurs. There are numerous indicators available. So, before using this indicator, double-check the formulas and settings.
Doji
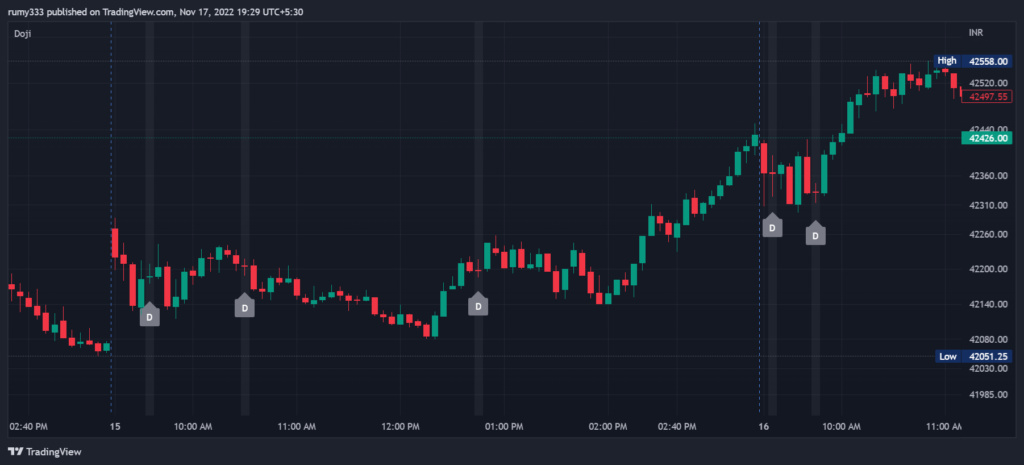
There are separate indicators for different candlestick patterns, such as bullish engulfing and bearish marubozu. This indicator in particular alerts us whenever a doji signal appears.
Gaps
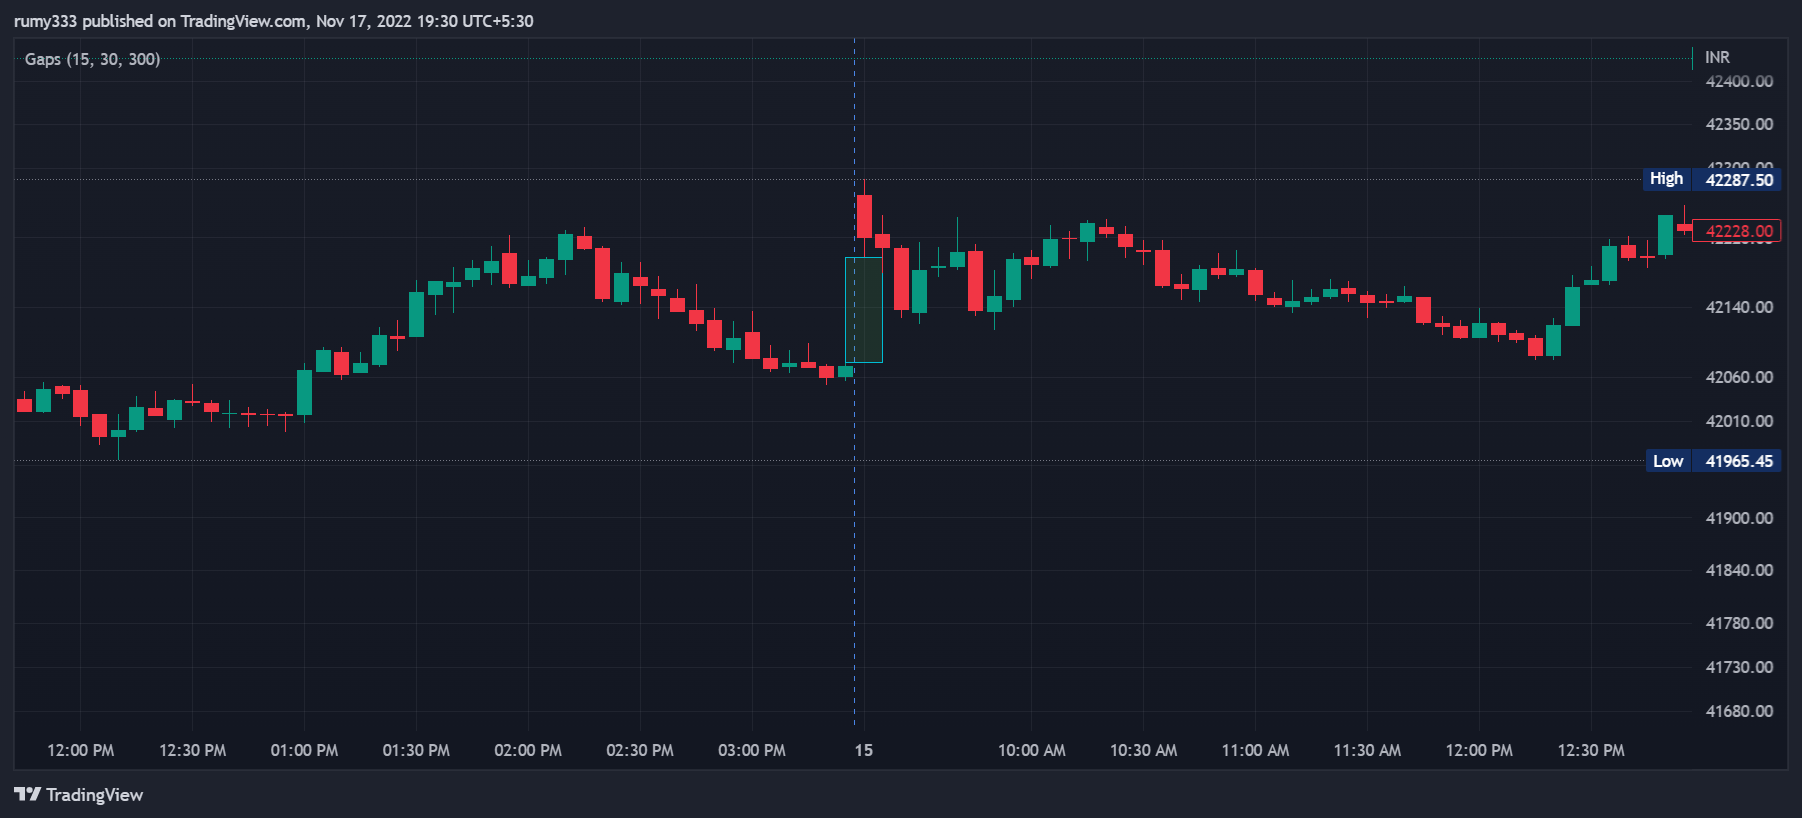
At the beginning of the market, gaps form. Typically, the open price is significantly higher or lower than the previous close price. The space in between is referred to as the gap. Typically, the market fills the gap sooner or later during the day. This indicator alerts you whenever a gap appears.
Higher high lower low..
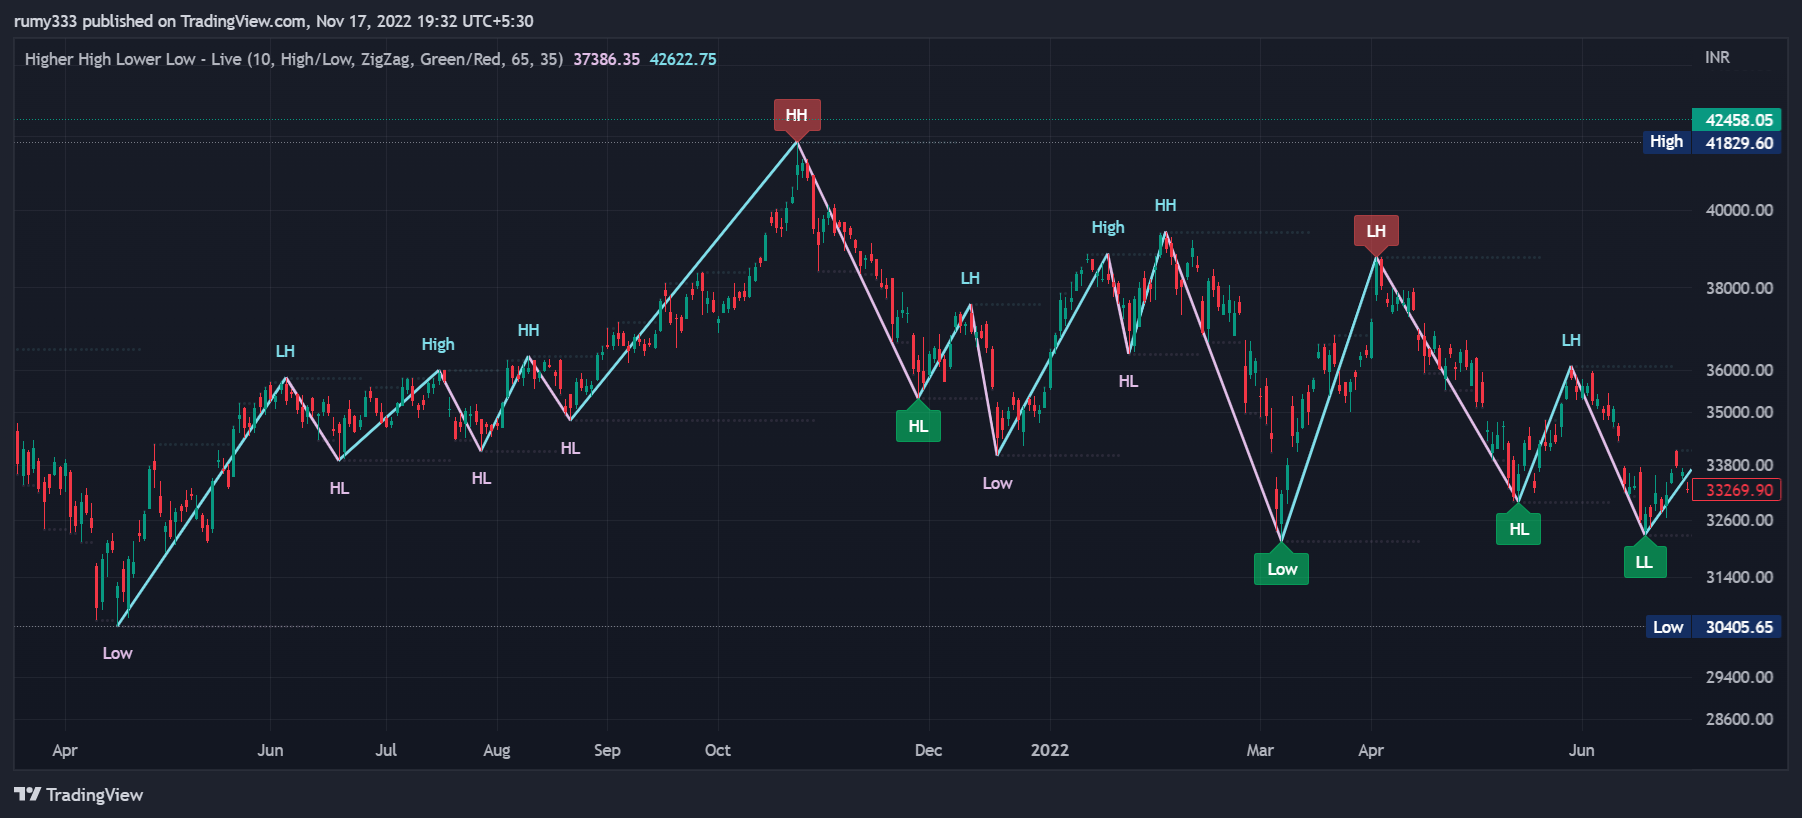
If you are unsure of the market structure and want to draw higher highs and higher lows or lower lows and lower highs, you can use the higher high lower low indicator. These highs and lows are generated automatically; however, you can change the settings or simply add support and resistance lines to it.
Hourly separator indicator
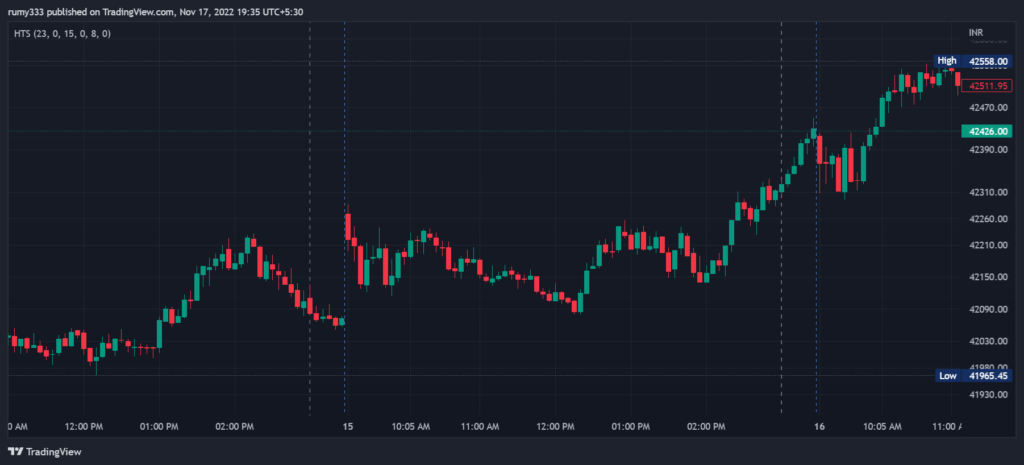
This hour seperator indicator can be used to time the market and track when the market is most volatile. If you specify the time at which the line should be drawn, it will draw vertical lines at that time every day.
ORB

The ORB indicator comes next. It is an abbreviation for opening range breakout indicator. So, if you set the timer to 5 minutes, it will show the opening range of the first 5 minute candle. That is, a line will be drawn at the first 5 minute candle. Similarly, if you want the first hour to be open, just set it to 60 minutes and you’re good to go. Traders typically trade the stock’s break out of this range. You can enter if it crosses the orb level.
Pivot points

The pivot points indicator is a technical indicator that signals support and resistance lines based on standard, fibonacci, and other formulas.
Simple reversal point
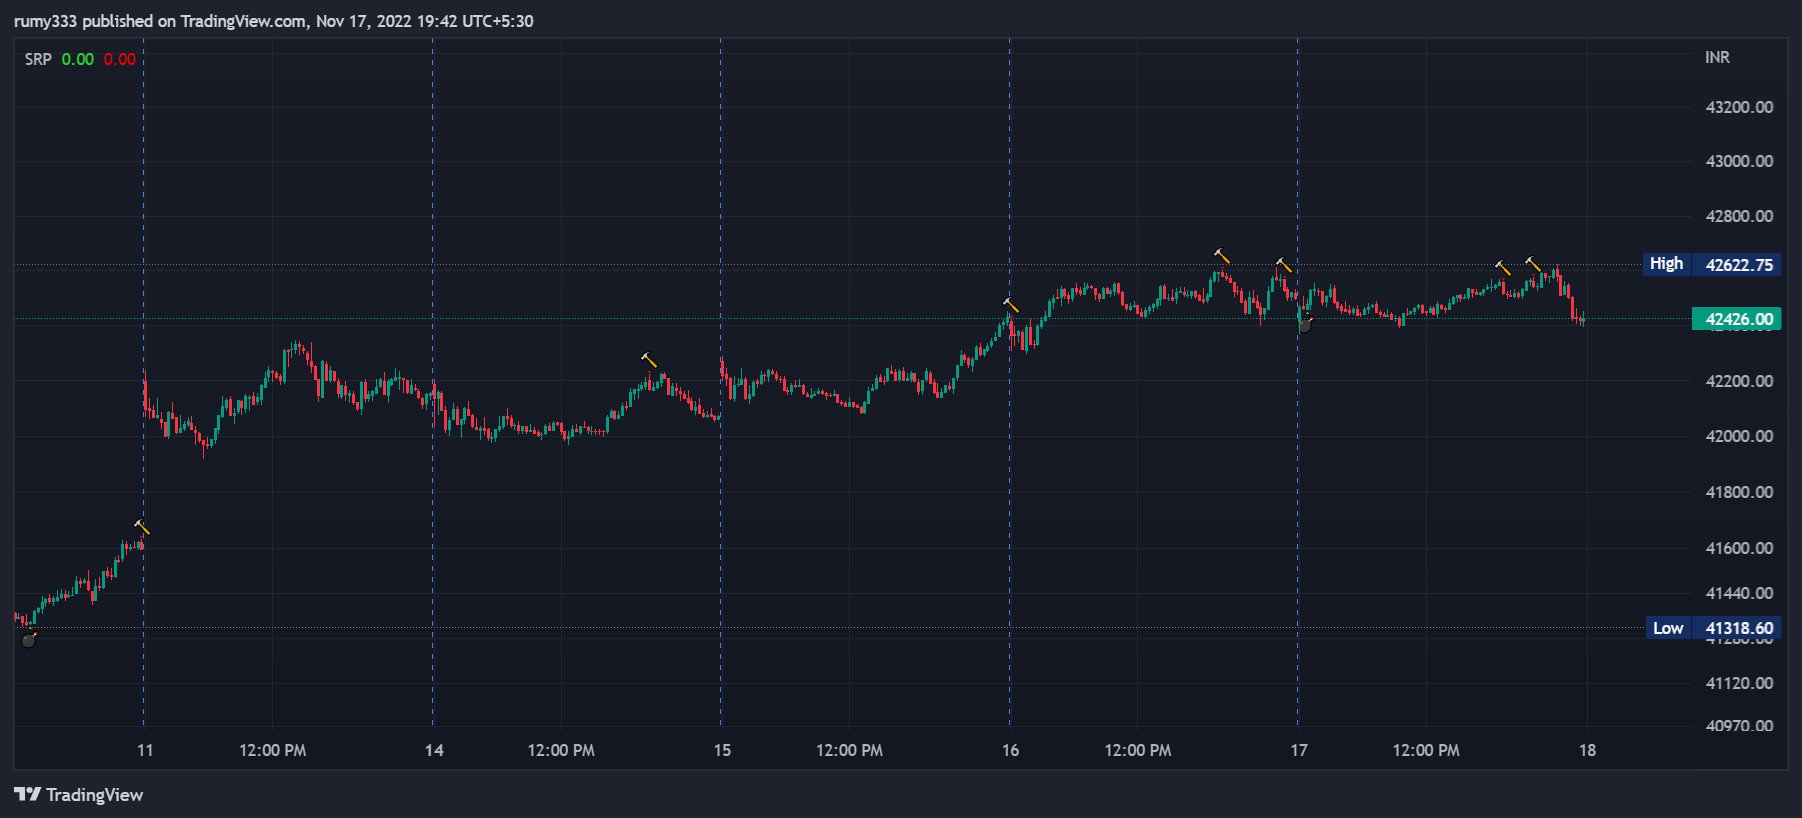
Simple reversal points indicates the swing reversal or small reversals on any chart.
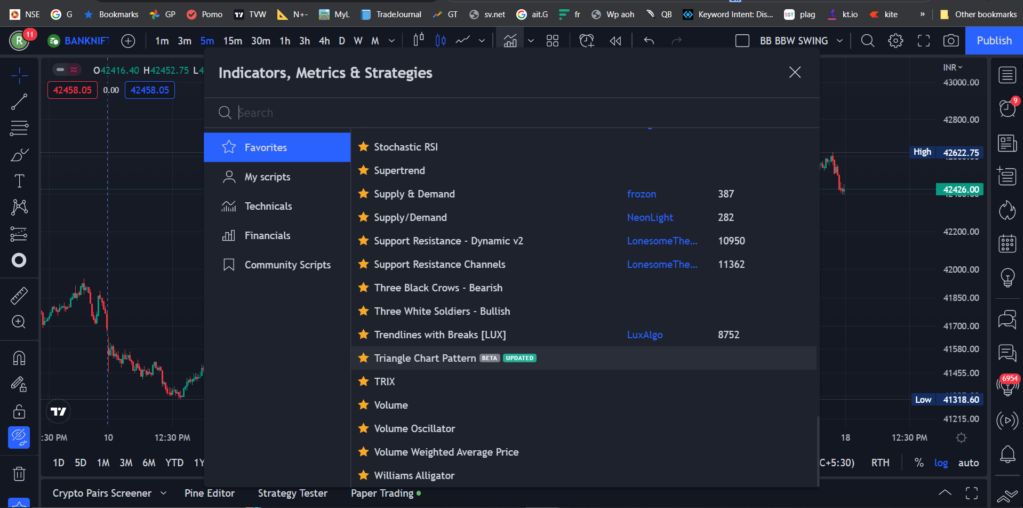
Supply and demand

The supply and demand indicator shows the area of the supply and demand zones. This is not a definite line, but rather a zone or area with a high supply or demand.
Triangle chart pattern
There are a plethora of chart patterns available. This indicates whenever a triangle shape is formed. In tradingview, type the name of the individual chart pattern indicator to find it.

Volume
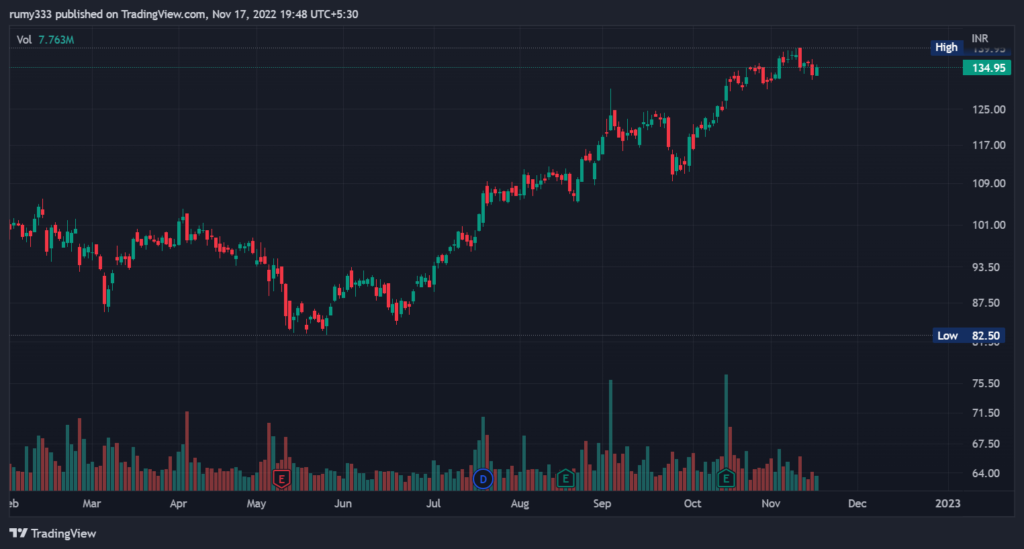
The volume indicator is the most commonly used price action indicator. Almost all traders use this indicator. So volume bars are very simple; they show the volume of a specific candle depending on the time frame you are using. If the volume is high, it indicates that the majority of people are interested in that stock at that time.
Trend lines with break

Then there are auto trend lines with breaks. When a trend line is formed, this indicator sends out a signal. When the trend line is broken, you can enter.
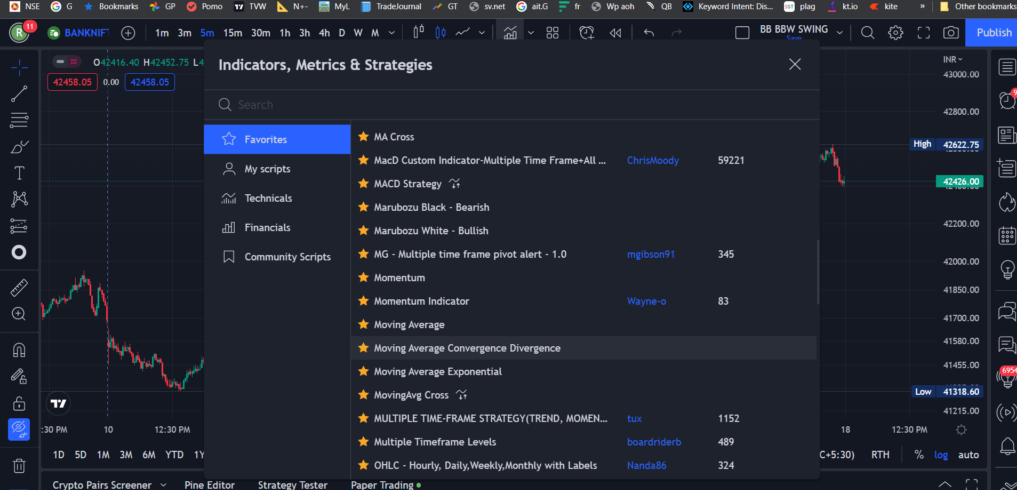
These are some of the indicators I used. Screenshots were taken so that the name of the indicator and its creator could be seen.


Resources & Links
Tradingview – Charting Platform
Zerodha – Trading brokerage platform (India)
Disclaimer
Trading involves substantial risk, and past performance is not indicative of future results. Always conduct your own research and consider seeking professional advice before making any investment decisions. The information provided on this platform about digital entrepreneurship is based on the author’s experiences and industry knowledge. It should not be considered as financial, legal, or business advice. Please consult with experts in these fields before making business decisions. This blog may contain affiliate links, and we may earn a commission if you make a purchase through these links. Your support is appreciated.
